People
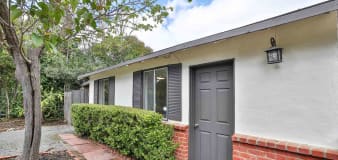
384 Sq. Ft. Home Sells for Over Its $1.7 Million Asking Price — Here's Why
Fox News
Homeowners score victory against squatters in New York after landlord handcuffed in $1M home heist
Reuters
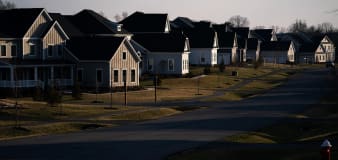
US new home sales rebound to six-month high; rising mortgage rates a concern
Associated Press
Hawaii lawmakers take aim at vacation rentals after Lahaina wildfire amplifies Maui housing crisis
Associated Press
Finding an apartment may be easier for California pet owners under new legislation
Advertisement


Advertisement
In Other News

Advertisement